


This post is part of a series where Joel Tosi and I write about the course we are developing titled “The Thinking Leader’s Toolkit”.
Back in 2001 I published “Better Testing, Worse Quality.” The paper came out of my lived experiences. Since its publication over two decades ago so many others have said that it matches their experiences. This week we’re using causal diagrams to take a fresh look at this phenomenon.
Things start with the recognition that quality (a notoriously difficult-to-measure characteristic) is slipping. The cause? “We’re shipping too many bugs!” Shipping more defects results in a lowered perception of quality. So far so good.
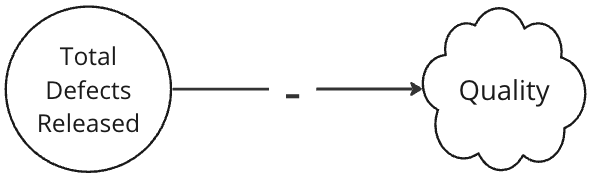
The solution? “We need to test more!” If we test more, we’ll find more defects and quality will go up!
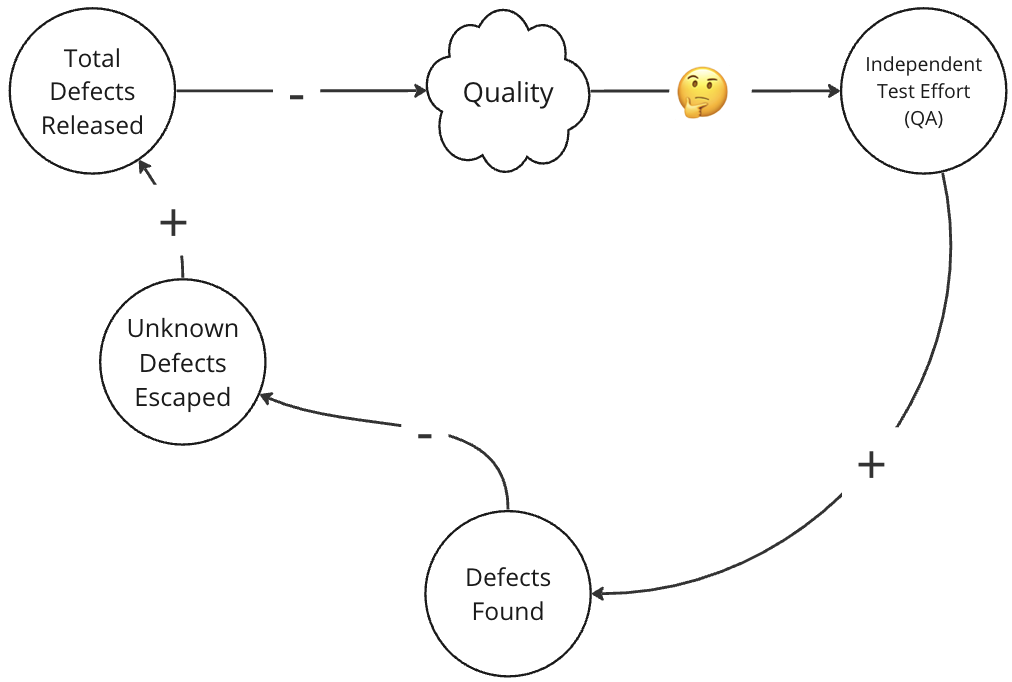
There are two problems with this theory. First, the organization has to make time to actually fix the defects found in testing.
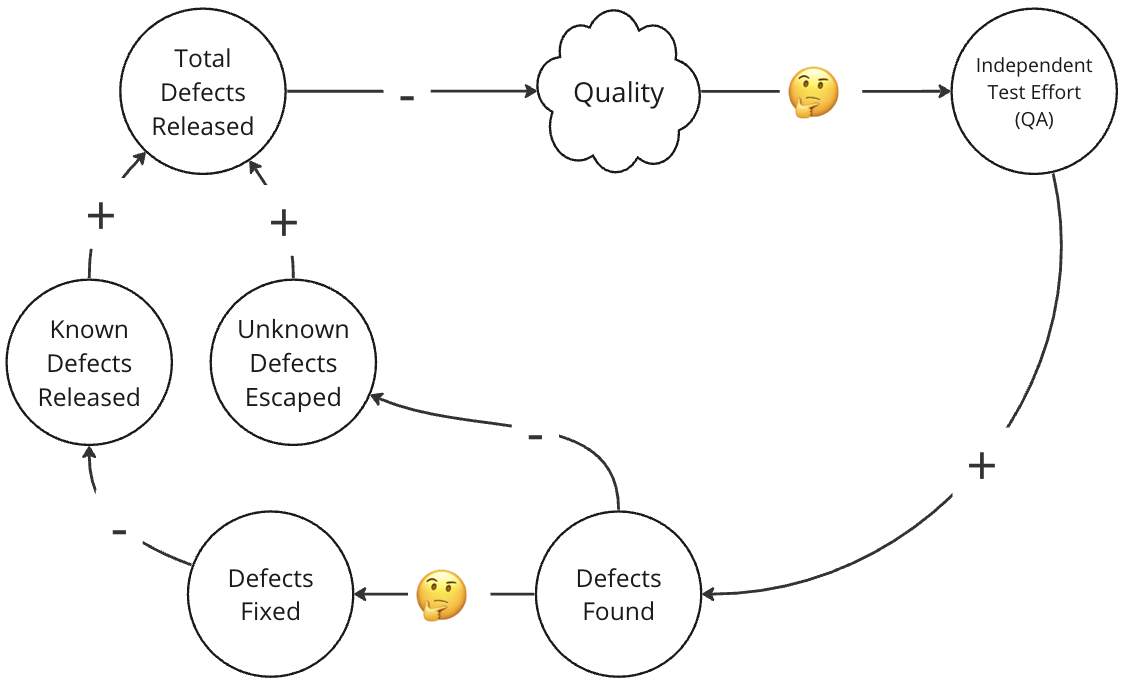
Otherwise the total number of defects remains the same…it’s just that more of them are known before release. (There’s probably a joke to be made here about rearranging defects on the Titanic.)
The other problem is the punchline of the paper: if someone else is doing more testing, the developers are likely to do less.
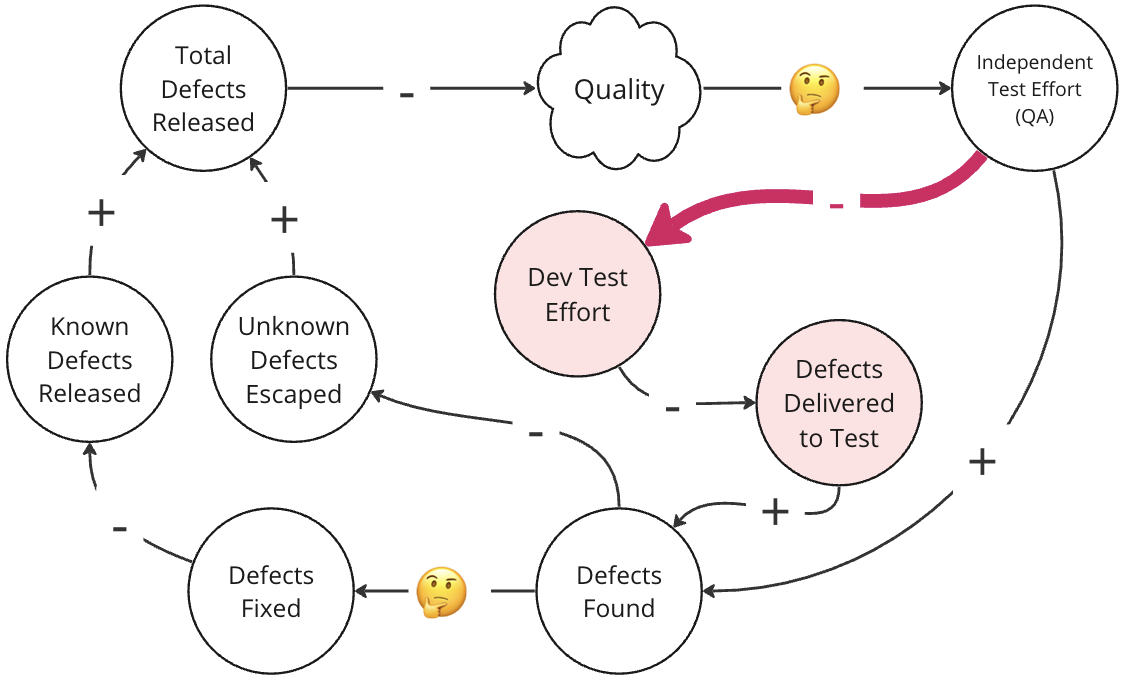
Ironically the very same leaders who decided to invest in independent testing may be the same people who tell the developers to hurry up and get their code in to test. Developer testing effort goes down and the number of defects in the code goes up. But QA finds lots of defects so the strategy is working, right? Well, no. QA is operating in a target rich environment. The organization has shifted right (testing later) instead of left.
As long as the organization’s response to worse quality is to increase external QA rather than investing in shifting left, the organization is in a reinforcing loop. Cycle times take longer and longer until progress grinds to a halt. In the most egregious cases it becomes a death spiral. But it’s natural to react to a quality problem by investing in more testing. And it’s also natural to want to be selective about which defects get fixed. Shift Left requires making decisions that can feel counterintuitive.
Analyzing the situation with a causal diagram can help you identify the decision points where you can intervene. In this case, that’s:
- How do you respond when you realize that quality is slipping?
- What do you do about defects?
Ultimately that’s the point of the The Thinking Leader’s Toolkit: to give you tools, like causal diagrams, that help you identify points of leverage, think through your choices, and consider possible unintended consequences.