


This post is part of a series where Joel Tosi and I write about the course we are developing titled “The Thinking Leader’s Toolkit”.
Let’s about one of the first thinking tools we introduce in the course: causal loops.
Consider an all-too-familiar story. A development team is under pressure to deliver features. They’re so busy rushing features out the door that they don’t have time to think through design decisions, refactor, or automate testing. As the code base grows, the level of technical debt grows. It becomes harder and harder to understand the code and reason about the potential impact of any given change. As a result, it takes longer and longer to deliver new features. Stakeholder patience wears thin. So the pressure on the team increases. The team rushes even more. The code base gets worse. Changes take longer. The team is caught in a spiral.
We can draw that spiral as a causal loop:
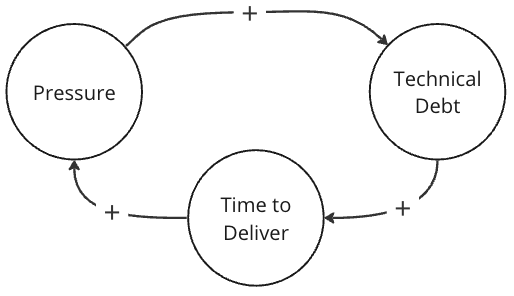
The arrows show the direction of the causal relationship. The + signs show that the two attributes on each side of the arrow vary together. As pressure goes up, technical debt goes up. As technical debt goes up, time to deliver goes up. As time to deliver goes up, pressure goes up. And so on. Things just get worse and worse. In causal modeling, this spiral is called a “reinforcing loop.”
The way this loop is drawn it looks like the downward spiral is an inevitability, but that’s not accurate. Putting pressure on the team is a choice. So instead of putting a + sign on the diagram, let’s use the thinking emoji to indicate that there is a choice to be made.
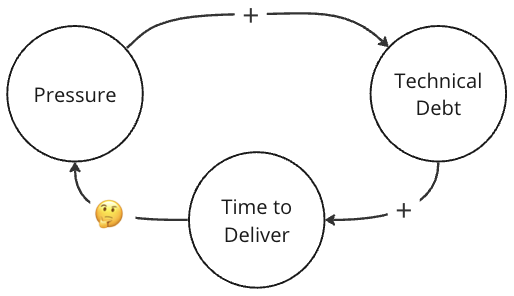
A causal loop diagram can help you see (and explain to others) where you might make a different choice. In this particular case it shows why pressuring the team is likely to backfire.
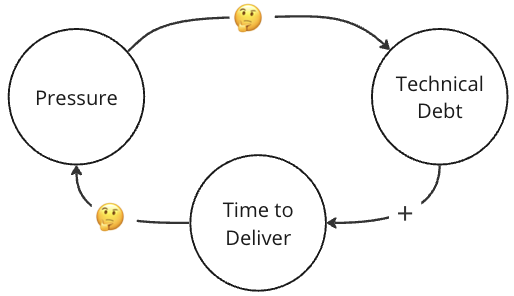
If you can break the connection between increased time to deliver and pressure, you’ll break the cycle. It’s even better if the team does not automatically respond to external pressure by cutting corners. Let’s update the diagram to show that taking on technical debt is a choice.
What else could improve time to deliver? The connection between increased technical debt and time to deliver is a reality of software development, not a choice. But the team could adopt a working agreement that they will spend more effort to improve code quality if they notice technical debt increasing. The causal loop diagram for that working agreement looks like this:
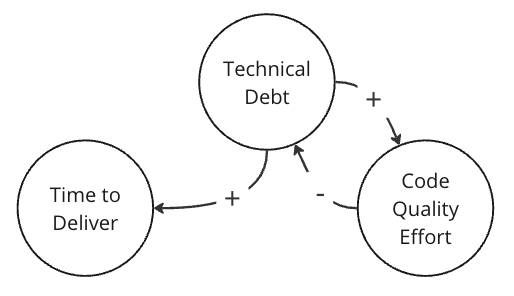
Tech debt goes up, effort to improve code quality goes up, tech debt goes down. In causal modeling, this is a “balancing loop.” Balancing loops stabilize the system, preventing runaway death spirals.
But wait! The diagram isn’t complete. There are so many more things that affect time to deliver and technical debt, like multiple teams committing to the same codebase, how easy it is to set up tests, skills on the team, familiarity with the domain, and much more. If we want the diagram to be comprehensive we would need to add all those factors in. Yep, causal models can become quite large. Complex systems are complex.
The good news is that you don’t have to build a comprehensive model before it becomes useful. You can choose a target attribute that you want to change, like time to deliver, and then build out just enough of a model around that attribute to see where there are reinforcing and balancing loops. From there, you can identify choices that you might make—or encourage others to make—to break out of harmful reinforcing loops.
That’s the power of the thinking tools: they make the forces affecting your context visible so that you and others can make different decisions.