


This post is part of a series where Joel Tosi and I write about the course we are developing titled “The Thinking Leader’s Toolkit”.
This week we are sharing a topic that appears in the middle of the course: U-curves. They’re most commonly associated with optimizing batch size, but it turns out they’re useful in many situations where there isn’t an ‘either / or’ answer.
Consider how your teams are staffed. Some organizations design teams around specialties. They might have a team of cloud specialists, another team of enterprise architects, a team that handles all of the resiliency testing, etc. Other organizations go the far opposite approach: all teams must be cross-functional. With cross-functional teams, every team needs to have every skill on it.
But is one answer right and the other wrong? Of course the answer to everything is “it depends.” But even taking historical decisions and context into account, is there an absolute right answer?
Imagine an organization with 50 teams producing software that leverages the cloud heavily. If they have specialist teams, perhaps they have a cloud team with, say, 8 people. For ease of math, let’s say each person has an annual compensation of 100K, so that team costs the organization 800K annually. At the other extreme, if every team were cross-functional they’d need a cloud engineer on each team: 50 cloud engineers at an annual cost of 5M. Easy decision, save money! But…and there is always a but.
Cloud engineers have specialized skills that those 50 teams need to move forward. Let’s imagine that those 8 engineers can each help 1 team per week. So a product team might have to wait a month and a half to get help. Over the course of a year, each team might see about 24 weeks total delay. How much opportunity cost have they burned? Turns out cheaper solution isn’t actually cheaper if we take into account the cost of delay. Easy decision, cut that time to 0! Except the organization probably doesn’t have the budget to hire 42 more cloud engineers.
But does it have to be either / or?
This is where U-curves come in. Here’s a chart that shows the costs in the example. The blue line shows the total annual cost increasing as the number of cloud specialists increases. The red line represents the cost of delay. The delay cost goes down as the number of cloud specialists increases because teams have a shorter wait.
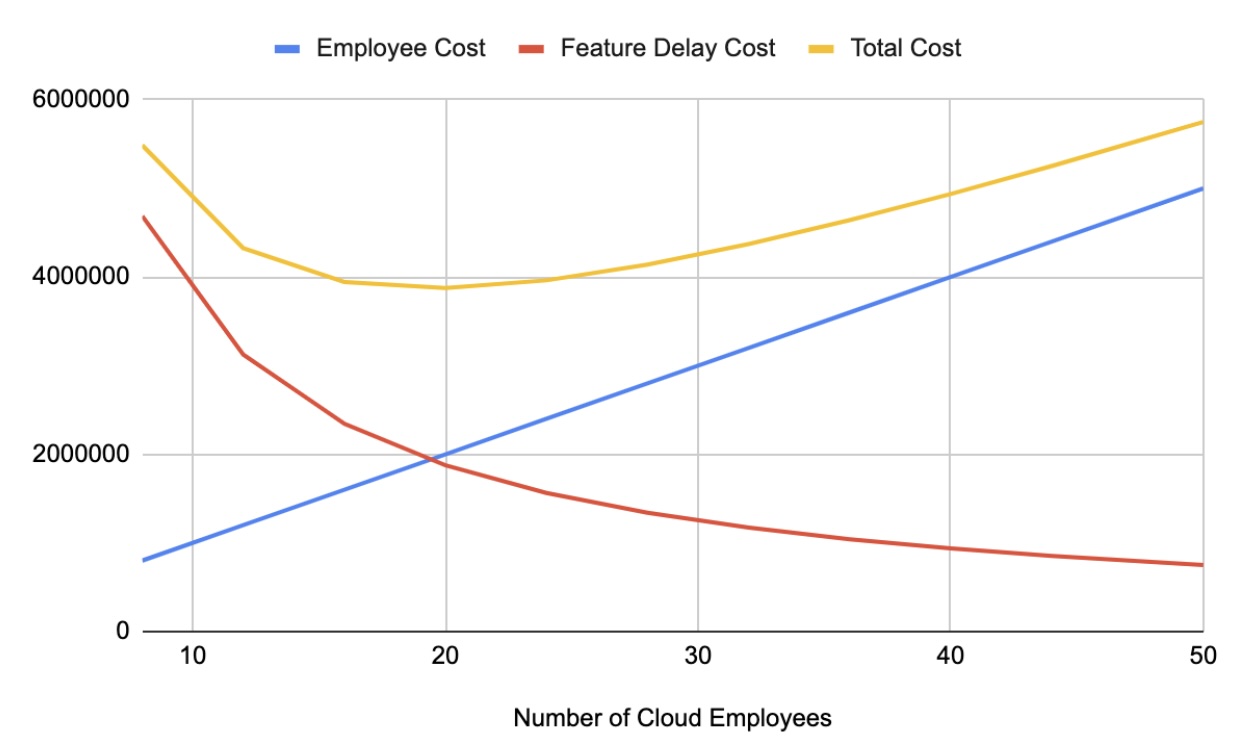
The chart shows that the greatest cost is at the two ends of the extreme (8 specialists or 50 specialists), but there is a range of good answers in the middle. The next question would be how to allocate those specialists to teams and how to organize their work. Multi-tasking is also expensive, after all. But that’s a topic for another day.
The point here is that plotting the tradeoffs with a U-curve chart can help you avoid getting trapped in either / or thinking that leads to very expensive decisions, like organizational restructuring that only considers two opposing ends of a spectrum. Thinking tools like this can also help you spend less time trying to get it all exactly right, and instead think in terms of setting up more options for the future. More options, more opportunity to develop a strategy.
You can use U-curves to visualize your options any time you considering costs and tradeoffs: greenlighting initiatives, infrastructure investments, hiring strategy, team staffing, etc. U-curves are everywhere!