


This post is part of a series where Joel Tosi and I write about the course we are developing titled “The Thinking Leader’s Toolkit”.
This week, we’re talking about a tool we introduce later in the class: Shewhart charts.
Shewhart charts (also called Process Control Charts) show not just data but also guardrails indicating what’s within the “normal” bounds for your context. That additional bit of information tells you how variable your data is so you can distinguish signal from noise.
We could talk about how to create Shewhart charts (and we do in the course) but today we’ll just focus on what they tell us about variability.
Imagine you have a team that estimates stories with points. On average they complete 20 points per sprint. Every week the number of points they complete varies, but this week they happened to complete 25 points. That’s 25% above average. Woot! We’re going to ship early! Right? Right…?
Of course you know not to get excited about a single data point. But what if velocity dips to 10? Should you be concerned? Maybe, maybe not. The real question is if 10 is within the normal range for the team.
A team’s velocity is a function of the system, and that system changes over time. The software evolves. Customers make requests. The organization undertakes new initiatives. Support tickets flow in. New hires arrive. People change teams. Teams grow and shrink.
Variability is inevitable. Average doesn’t tell us much. But understanding the normal range tells us a great deal.
In 1989 Myron Tribus wrote a marvelous paper titled “The Germ Theory of Management.” In it, he called variability “the virus of systems.” He also laid out the history of Shewhart charts, and said:
Few people understand what uncontrolled variability does to the cost of doing business. Fewer still understand what can be done about it and what is the management’s role.
Consider the team where velocity dipped. Some leaders (not you, of course) might be tempted to ratchet up pressure to deliver, to “create a sense of urgency.”
That sense of urgency could translate into the team delivering more points. But at what cost? Maybe they cut corners, test less, and copy paste logic. A few sprints later the team is hit with late-breaking surprises. Velocity plummets. Variability increases.
“Well the reason our velocity is so low is because we’re fixing bugs,” the team explains.
Some leaders (again, not you, of course) might respond that they want to understand the capacity of the team, so bugs should count toward the team velocity. If team capacity stays relatively constant, the variability in the velocity chart lessens. The team drove out variability, right? That’s good, right?
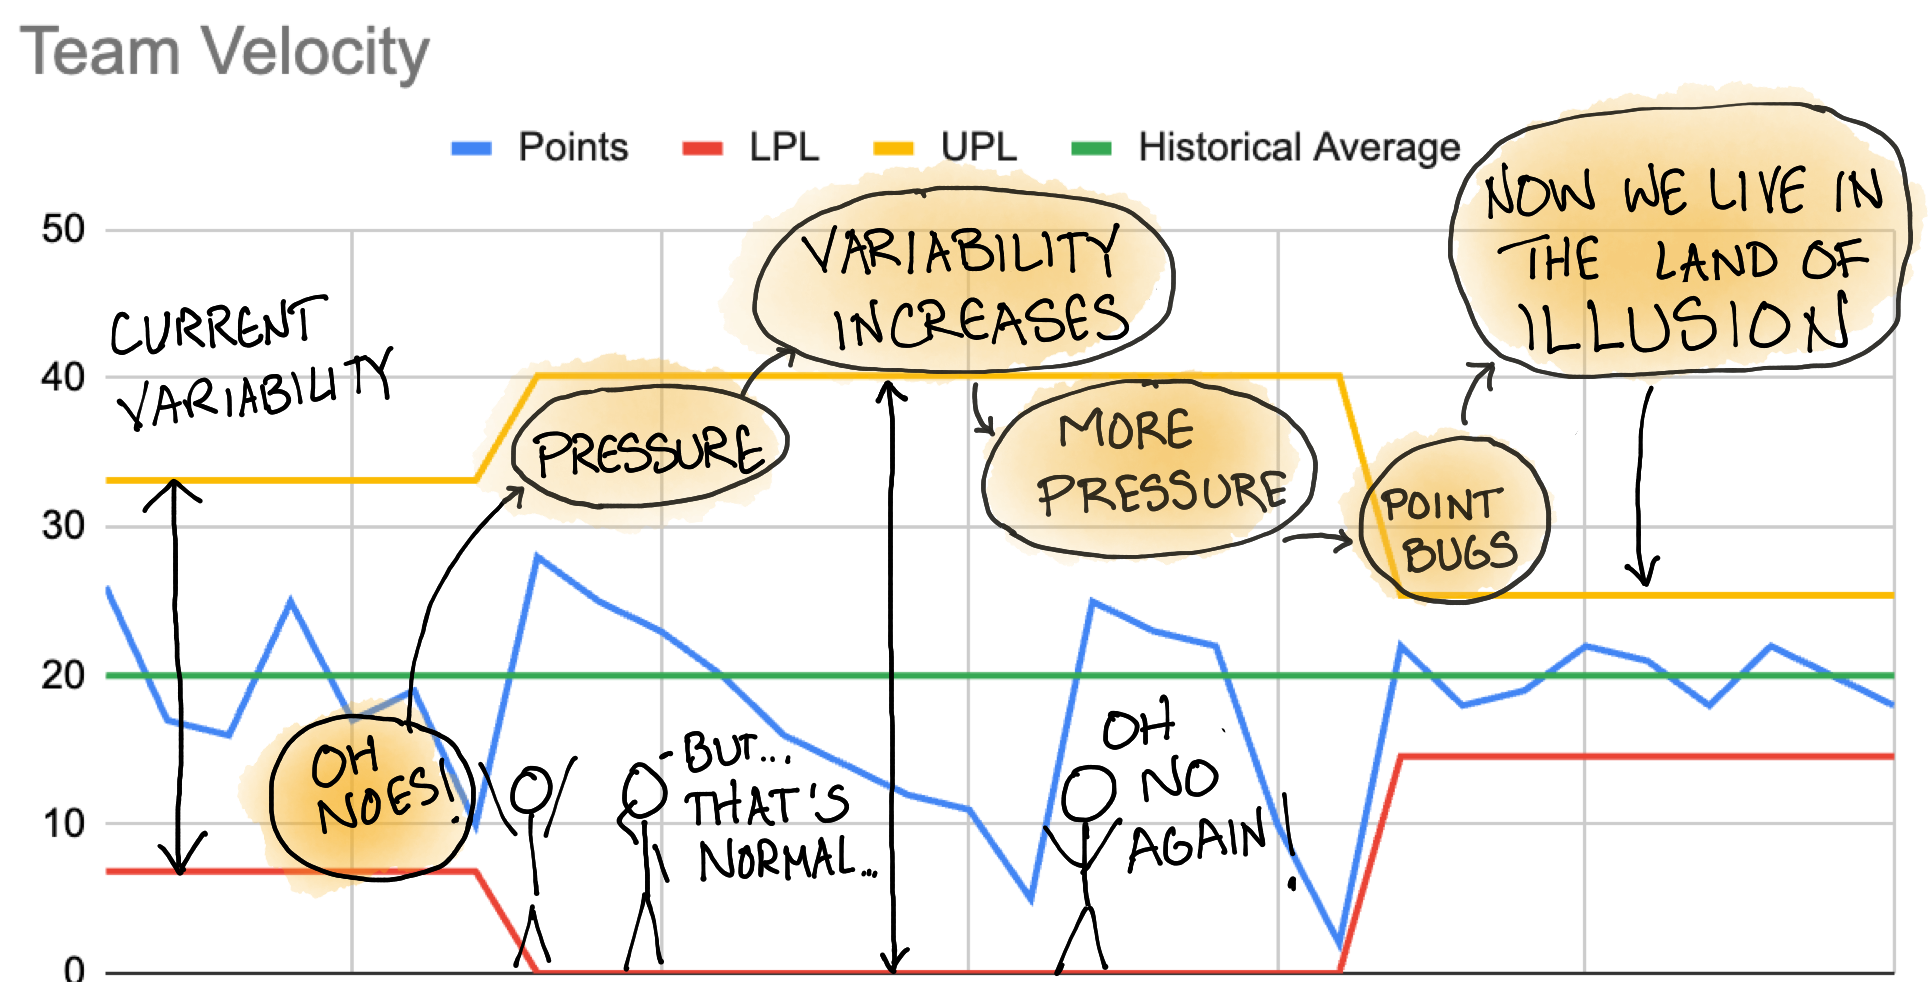
Well, no. Now you have an even more insidious problem. Velocity no longer represents value delivered, it represents tickets completed. That means the variability no longer reveals how consistently (or not) the team can deliver value. Variability isn’t being controlled; it’s hidden.
Shewhart charts show you how much variability naturally occurs in your process. That gives you insight about when an intervention is actually needed. It also gives you critically important feedback on changes you make to the organization and process. But you have to be able to trust the data. And that means accepting the data for what it is rather than trying to make it look good.
What if the chart shows that variability is higher than you’d like? How can you drive out variability? Last week we talked about causal loops. If you started to model causal loops associated with velocity variability, you might find something like this:
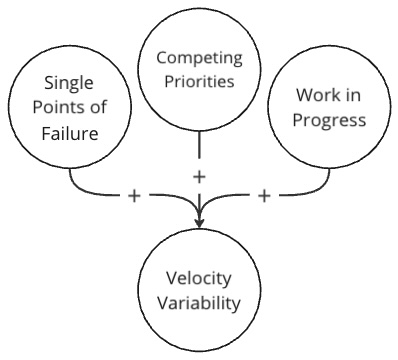
If you modeled it out further you might even find relationships that go the other way. Perhaps as velocity variability increases, there’s a tendency to increase the number of single points of failure, the competing priorities, and the amount of work in progress. Maybe there’s a reinforcing loop such that an increase in variability results in a greater increase in variability.
That’s the power of these tools. They support one another, giving you the insights you need to see when and how to take action.